The Kestrel Ledger is a nine-person nonprofit newsroom in Kestrel Falls, Ohio, and it doesn't exist. I built it for the 2026 News Product Alliance Summit, with about 7,000 fictional readers and 11,665 rows of audience data, and I went to some trouble to make sure that data was a mess.
The News Product Alliance (NPA) brought me in to co-design a three-hour hackathon in Chicago on October 23, 2026, built on the Audience Data Commons (ADC), NPA's open project for connecting the audience data newsrooms already have. We expected most of the room not to be developers, most not to have data of their own to bring, and most to be meeting the ADC for the first time. So every team started with a question about its audience instead of something to build. The session filled to capacity, eleven teams took part, and three of them ran their own newsroom's data through the ADC in a single morning.
My part was the design and the materials: the session plan, registration copy, judging rubrics, submission form, starter dataset, and a handoff package for the people running the room. Darla Cameron facilitated on the day and Dave Williams of Microsoft co-hosted. I've been in the NPA Slack for a couple of years, and this was my first time at the Summit.
The Problem: Audience Data Spread Across Systems That Don't Connect
Newsrooms own a lot of information about their audiences, and it's scattered across a newsletter platform, a donor CRM, survey tools, a comment system, and event tickets. Which newsletter subscribers also donate? Do the people who comment look anything like the people who show up to events? No single system can answer either one.
That's the job the ADC is built for. It's a shared, open format for describing an audience, plus a tool that pulls everyday exports into that format and matches the people who appear in more than one. The goal of the morning was a better conversation about first-party data in newsrooms, with the ADC as the way in, because if you don't know what problem a tool solves, you won't use it.
The block ran three hours with two other sessions going at the same time, so people were going to step out and come back. And a build-it-first hackathon hands the room to whoever brought a developer, which is close to the opposite of who this morning was for.
Why Every Team Started With a Question
Every team's first job was to pick one thing it wanted to know about its audience that no single system could answer. Leading with the question changes who runs a team, because an editor or an audience lead can own a question, and the developer becomes the engine instead of the gatekeeper.
Teams had three roles. The question owner, usually an editor or audience person, kept the team pointed at what a newsroom would do with the answer. The driver did the hands-on work with the software, and one driver per team was plenty, because with two or more, the rest of the team ends up spectating. Everyone else dug into what the data showed and shaped the write-up.
Teams still built things to demo, mostly small working apps and dashboards. What they turned in was a seven-part write-up: the question, the type of data, what they did, how it works, what they found, where they got stuck, and what a newsroom would do with this on Monday. "Where we got stuck" is the field that changes how a room behaves. A team that hits a wall still has something to hand in, and every wall it names tells the people building the ADC where it needs to go next.
Because people would come and go, I designed each block to stand on its own, with a one-page "where we are right now" card for every table so someone walking back in could rejoin without a recap. I also made getting the data in the longest block on purpose, since that's where first contact with the ADC happens and everything after depends on it.
A Fictional Newsroom With Messy Data on Purpose
Most teams needed a newsroom to borrow, so I built one. I started with research on what small newsrooms struggle with: eleven reports, 246 sources checked, about $12.42 in search credits. The first plan sized the dataset at around 1,220 people to fit the clock, and I scaled it up to about 7,000 so that "how many people do we have?" would read like a real newsroom.
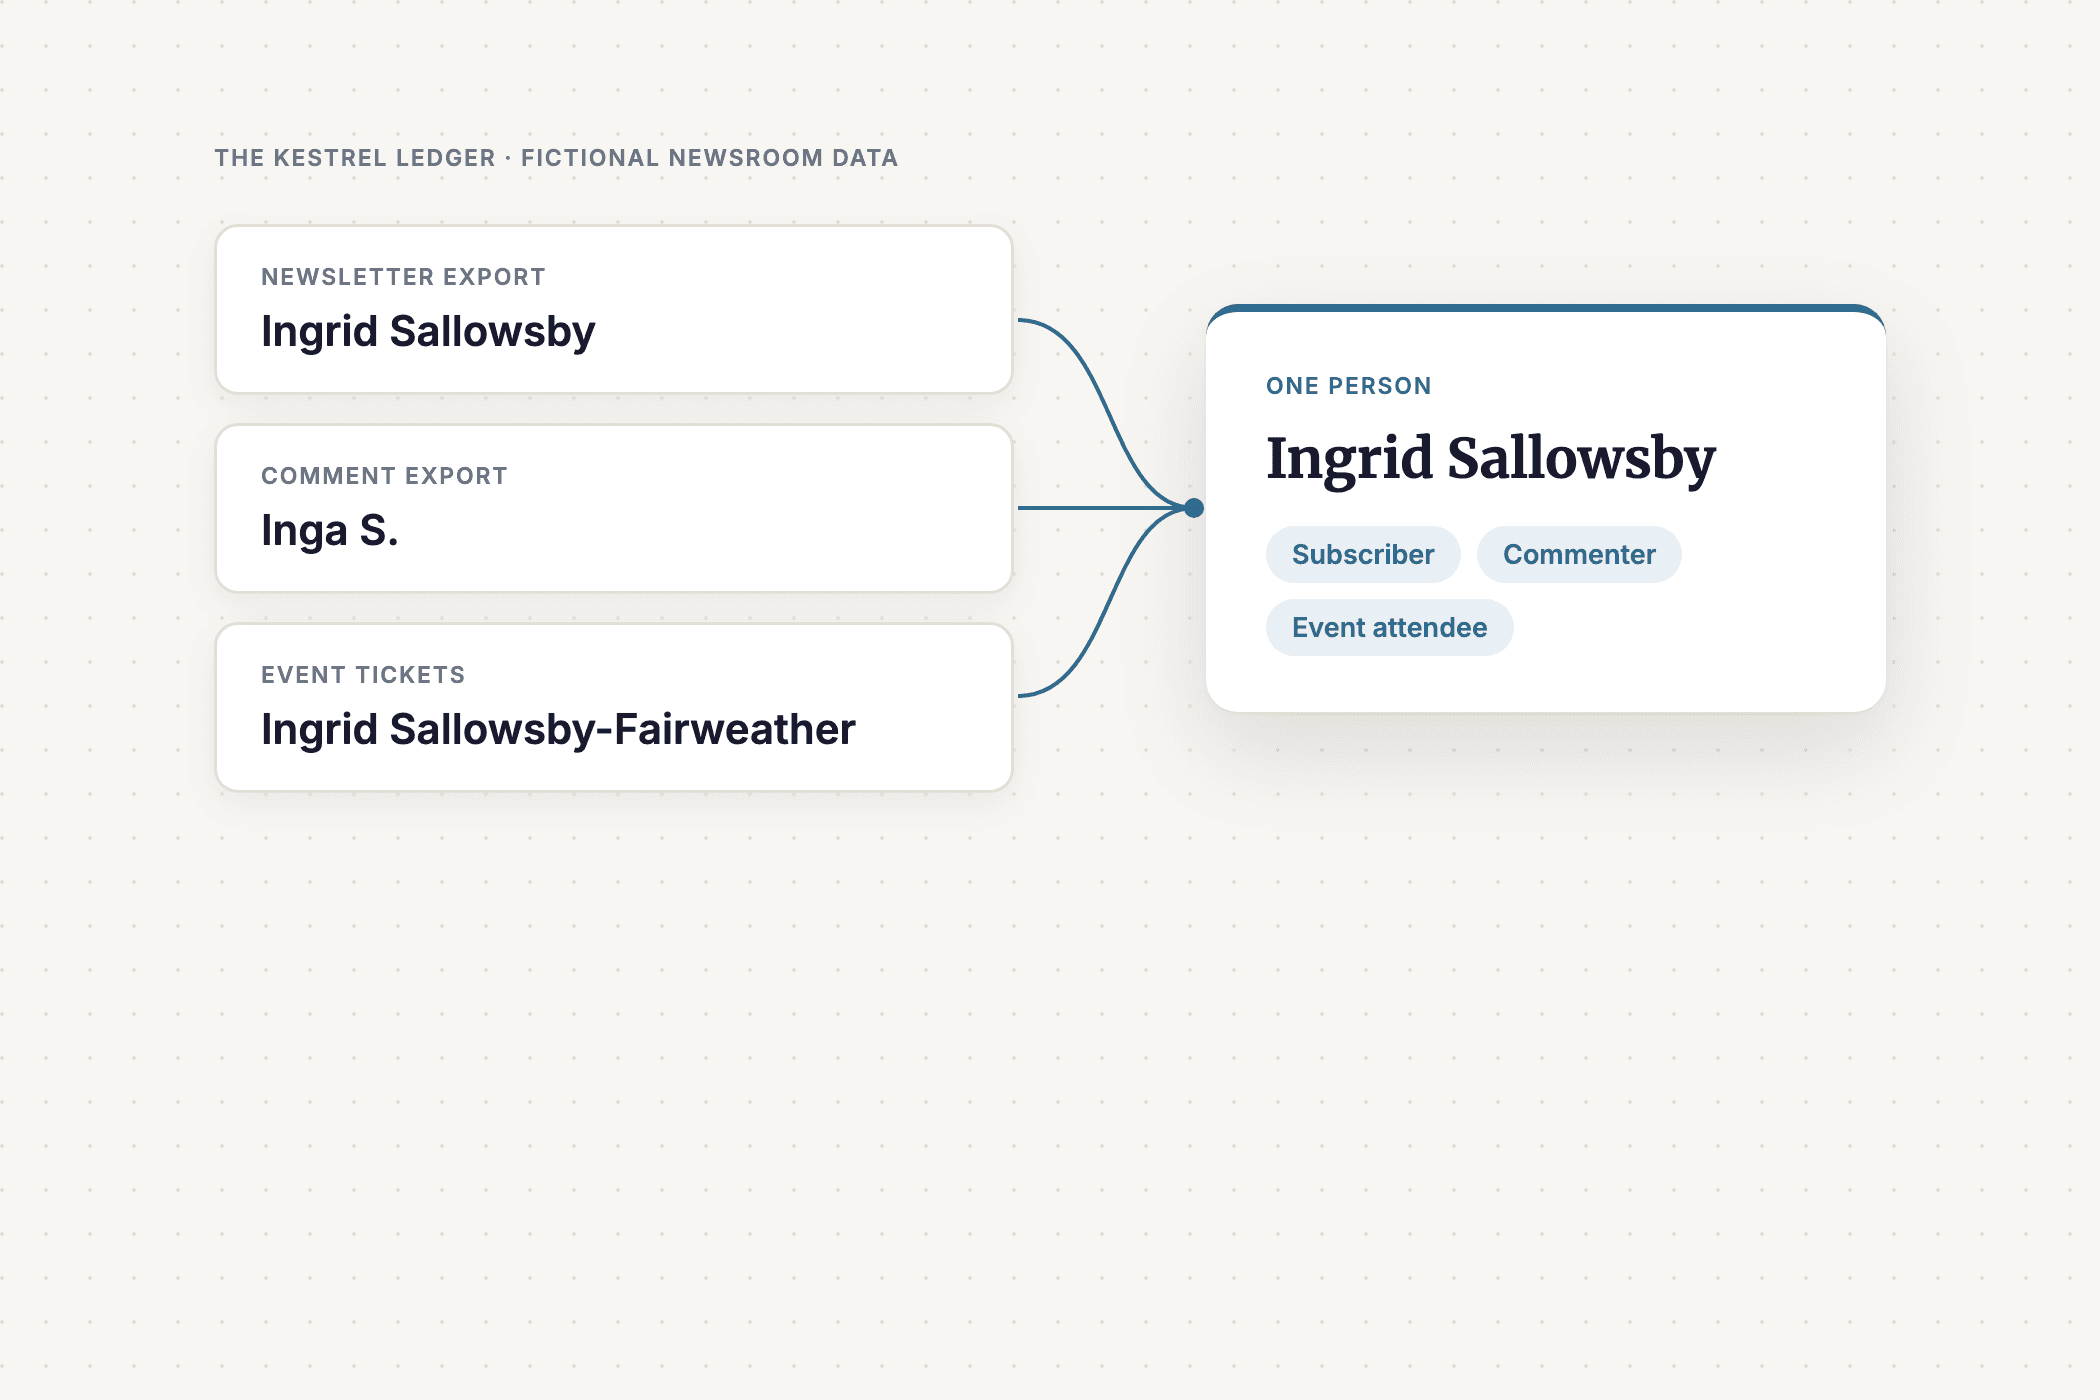
The Kestrel Ledger ended up with six exports in nine files, each shaped like the tool it imitates: Mailchimp, Salesforce, Google Forms, WordPress comments, Eventbrite, and Typeform. One reader shows up as Ingrid Sallowsby on the newsletter, Inga S. in the comments, and Ingrid Sallowsby-Fairweather on an event ticket. Three records you'd read as three people turn out to be one, and that's the moment the morning was built to create, where connecting your audience data stops being a concept and turns into something you can see.
I'm a product manager, not a developer, so I built the generator with Claude and tested the result the way I'd test a product. My rule was that testing could fix what was broken but could never clean up the joins, since the mess is what the ADC was there to solve.
AI personas playing an engineer and an audience editor worked through it blind, and the problems they found were mine: the starter file crashed for anyone without a real OpenAI key, and the participant instructions left out the actual command to run. Later I gave three AI assistants only the handout and eight questions, with the correct answers sealed beforehand. One of them got five of the eight wrong and labeled four of those "Confidence: High," in a write-up that read as well as the best one. The judging rubric warns about exactly that: "A polished, confident write-up isn't evidence of a correct one."
Scoring What a Judge Can Find
There were two prize tracks: technical excellence, scored by a panel, and community favorite, voted in NPA's Slack. For the panel, I wrote five levels for each of five criteria (technical execution, infrastructure and portability, question rigor, usability, and reflection), and each level names something a judge can find in the submission, the link, or the recording. I'd just finished rebuilding grant scoring rubrics for the Community Foundation of the Ozarks around the same test, after catching my own first drafts climbing on adjectives.
Nothing in the rubric rewards code for its own sake. A spreadsheet can score as high as a custom app, and a team that hits a dead end and says so plainly doesn't get marked down for it.
Community voters got three questions to ask about each submission. Is this a problem my newsroom has too? Could a newsroom like mine start doing this, with the people and tools it has now? Could I follow what they did from the write-up alone?
What Happened in the Room
Darla walked people through the thinking first: who their audience is, what problem they wanted to explore, and how to use data to get at it. Dave showed them Microsoft Copilot and a sandbox environment, and I helped troubleshoot for a few people stuck on setup. Watching people who were struggling with setup at 10 present working prototypes by 1 was really gratifying.
Teams asked the kinds of questions the format was designed for. Do events or the newsletter keep donors giving? What do unsubscribers do next, and can we keep them some other way? Who gets a call, a personal email, or the newsletter ask before GivingTuesday? The builds ran on Claude artifacts, Microsoft 365 Copilot with App Builder, custom web apps, and a Snowflake warehouse, and one team reported building its tool in Copilot in about two hours.
The app that got the biggest reaction from the room had a cartoon kestrel mascot, which nobody had asked for, and it was adorable and really impressive. Its cleanup screen ended in a tally, 11,665 messy rows down to 7,077 tidy people, which is the three-records-into-one moment turned into a progress report.
Results: Newsroom Teams Connected Audience Data in One Morning
The room filled up. NPA's email to attendees that morning called the session at capacity. Eleven teams formed, and ten posted a video of what they built.
Three teams used their own newsroom's data. One mapped about 856,000 rows into about 113,000 people, and the ADC's merge matched a separate email comparison exactly.
The hard part showed up where it was supposed to. Two teams working from the same Kestrel files reported 7,077 people and 8,781 people, because deciding which records belong to the same person is where connecting data gets difficult.
A wall turned into a useful answer. One team set out to build a predictive model for unsubscribers, found that 94.2 percent of them showed no activity afterward, said so, and built a monitoring dashboard and an opt-down page instead.
Teams showed their reasoning without being asked. Several built a "why did it pick this person?" view into their tools, so an audience editor could check a result instead of taking it on faith.
What I'd Tell Someone Planning a Hackathon for Non-Developers
Decide who you want running the teams, then build the format around them. The question-first challenge, the roles, the write-up, and the rubric all existed so an editor could lead.
Make the practice data hard in the ways real data is hard. A clean dataset would have taught people the ADC's commands and left out the reason anyone needs it.
And test your materials with someone who wasn't in your head when you wrote them. AI can drive a tool like this, and the AI personas found problems I'd missed, but AI can't pick the question or decide what the answer means for a newsroom on Monday. That part stayed with the people in the room.
FAQ: Running a Data Hackathon for Newsrooms
What is the Audience Data Commons?
The Audience Data Commons (ADC) is an open project from the News Product Alliance's AI Co-Lab. It's a shared format for describing a newsroom's audience, plus a command-line tool that pulls exports from systems like newsletter platforms and donor CRMs into that format and matches the people who appear in more than one.
How do you run a hackathon when most participants aren't developers?
Start every team with a question instead of a build, so an editor or audience lead can own the work. Give each team one person driving the software, and have teams turn in a write-up of what they asked, what they found, and where they got stuck. Provide practice data so nobody has to bring their own.
How do you create a synthetic dataset for a data hackathon?
Research what the real data looks like, then generate a fictional organization with exports shaped like the tools people actually use. Plant the problems real data has, such as one person appearing under several names, and test the materials blind. The Kestrel Ledger has six exports in nine files, covering about 7,000 fictional people.
How should you judge a hackathon where teams have different technical skills?
Write scoring levels that name something a judge can find in the submission, and let a spreadsheet score as high as a custom app. At the NPA Summit, the panel scored technical execution, portability, question rigor, usability, and reflection, and a community vote asked whether other newsrooms had the same problem.
Related Case Studies
- Plain-Language Scoring Rubrics for 21 Community Grant Programs – the same scoring test, written for volunteer grant reviewers and student grantmakers.
- CoinDesk Replatform: Arc XP to Sanity + Vercel – another news product where the planning before the build mattered most.